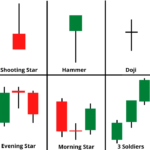
While technical analysis involves a wide variety of chart patterns, it’s important to note that no pattern guarantees profits, as the stock market is influenced by various factors, and patterns are just one tool among many. Additionally, past performance is not indicative of future results. That being said, here are 11 commonly recognized stock chart patterns that traders often analyze:
DOWNLOAD APP https://angel-one.onelink.me/Wjgr/5kre2etd
- Head and Shoulders:
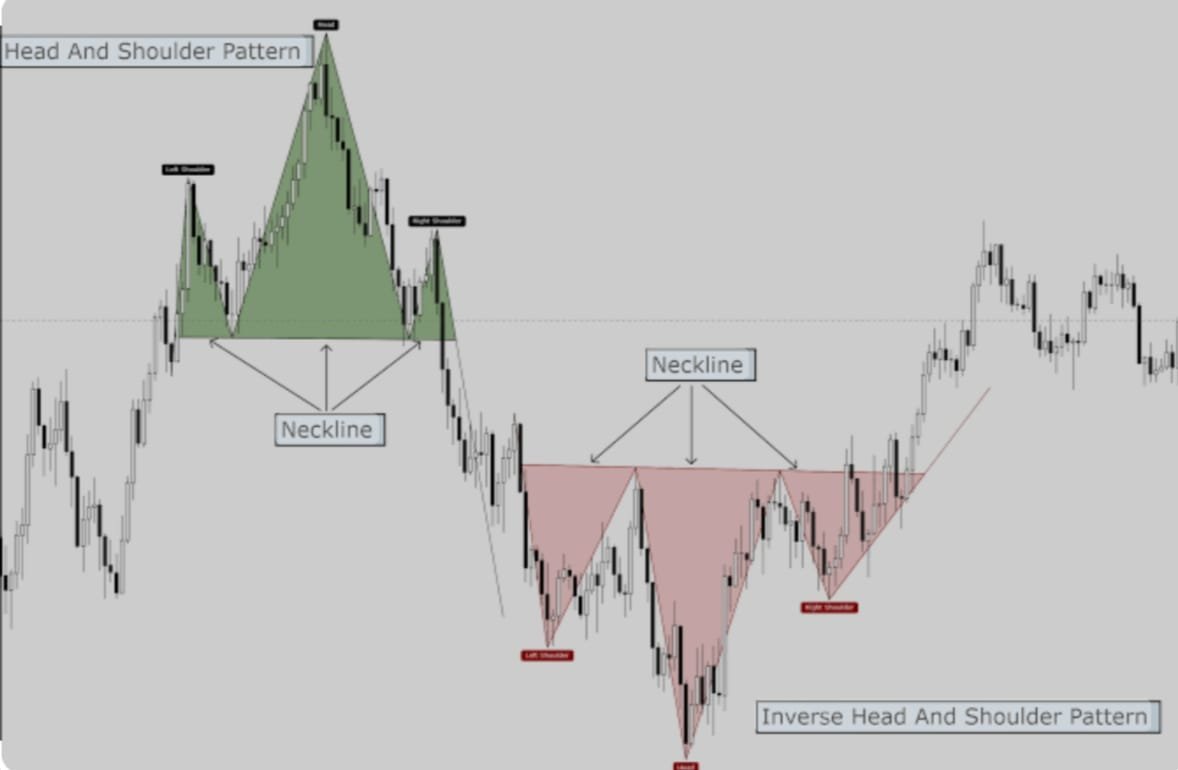
- This pattern consists of three peaks – a higher peak (head) between two lower peaks (shoulders). It is considered a reversal pattern, signaling a potential trend change.
A head and shoulders pattern is a chart formation that looks like a baseline with three peaks, with the middle peak being the highest and the outer two peaks being similar in height. The breakout occurs when the asset breaks the support level, and the pattern is so named because it resembles the human head and shoulders shape.
- This pattern consists of three peaks – a higher peak (head) between two lower peaks (shoulders). It is considered a reversal pattern, signaling a potential trend change.
- Double Top and Double Bottom:

- A double top is formed after an uptrend and indicates a possible reversal, while a double bottom is formed after a downtrend and suggests a potential reversal to the upside.
- Triangles (Symmetrical, Ascending, Descending):
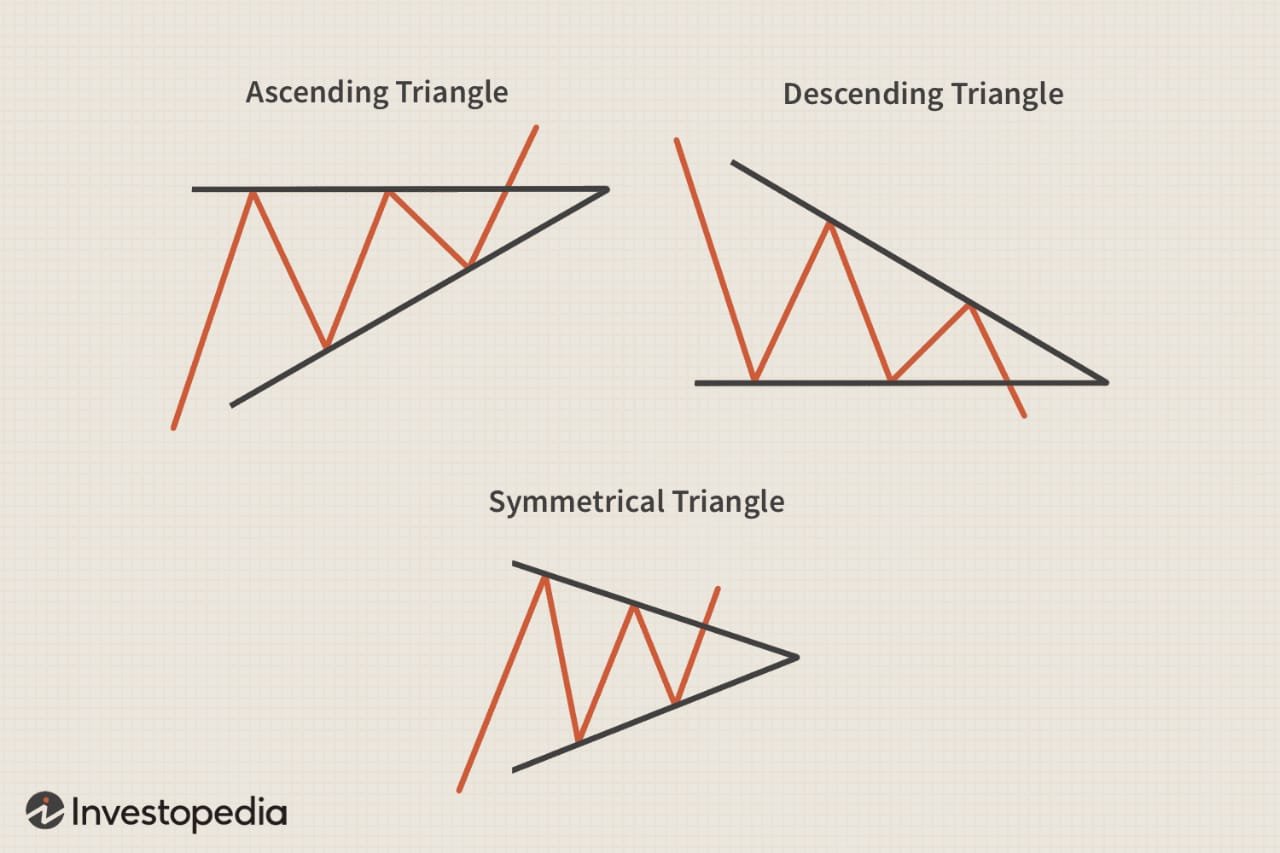
- Triangles are formed by converging trendlines and include symmetrical triangles (continuation or reversal), ascending triangles (bullish), and descending triangles (bearish).
- Cup and Handle:
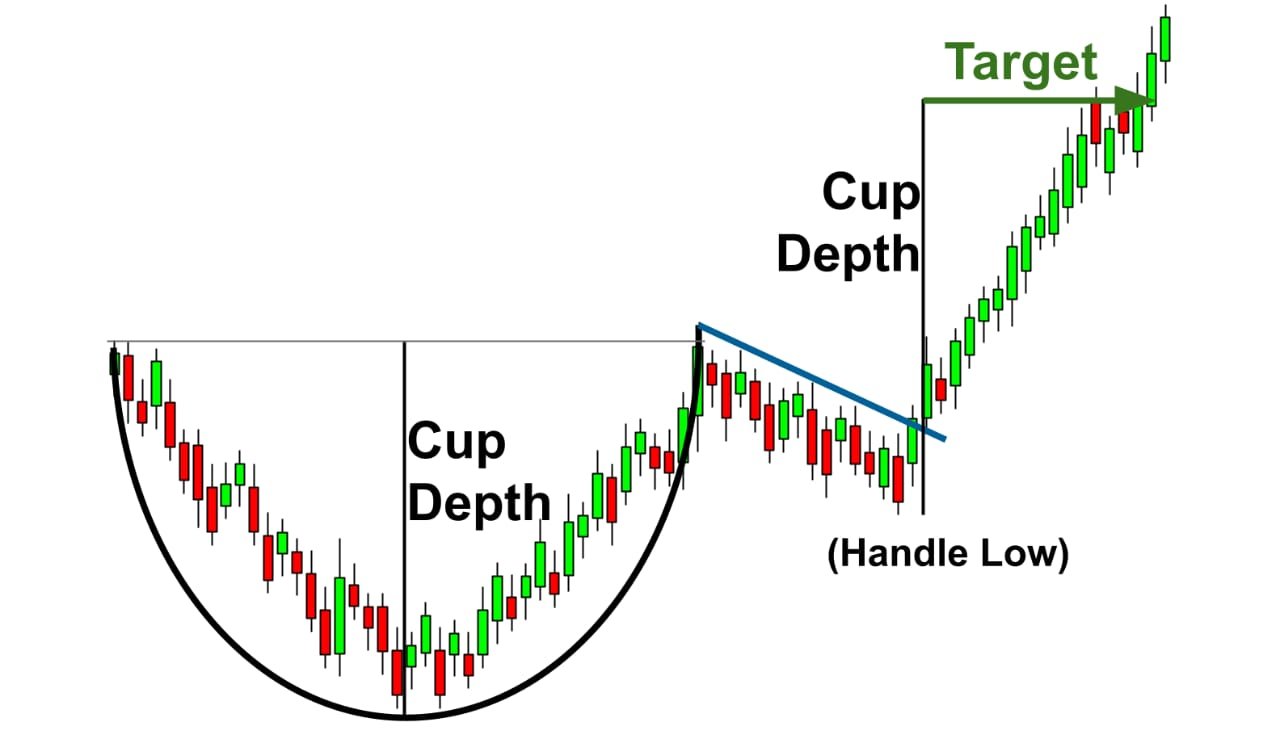
- This pattern resembles the shape of a tea cup and handle. It is considered a continuation pattern, suggesting that after a brief consolidation, the uptrend may continue.
- Flag and Pennant:
- These are short-term continuation patterns. A flag is a rectangular-shaped pattern, while a pennant is more like a small symmetrical triangle. Both patterns indicate a brief consolidation before the previous trend resumes.
- Wedges (Rising and Falling):

- Rising wedges are bearish continuation patterns, while falling wedges are bullish continuation patterns. They are characterized by converging trendlines.
- Double Top and Bottom Reversal:
- These reversal patterns consist of two well-defined peaks (double top) or troughs (double bottom). Double tops signal a potential downtrend, while double bottoms indicate a potential uptrend.
- Inverse Head and Shoulders:

- This reversal pattern is the opposite of the regular head and shoulders pattern. It signals a potential trend reversal from a downtrend to an uptrend.
- Similar to the typical head and shoulders pattern but with the head and shoulders inverted, an inverse head and shoulder pattern is used to forecast downtrend reversals. The price reaches a low point before rising then it drops below the previous low point before rising once more. Finally, the price declines once more, but not as far as the second low point. The price moves upward and breaks resistance after the last trough is made.
- Bullish and Bearish Engulfing:
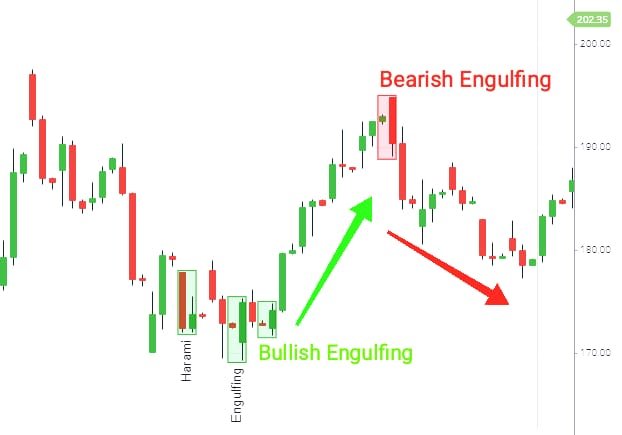
- Engulfing patterns occur when the body of one candle completely engulfs the body of the previous candle. A bullish engulfing pattern can signal a potential uptrend, while a bearish engulfing pattern may indicate a potential downtrend.
- Rounding Bottom:
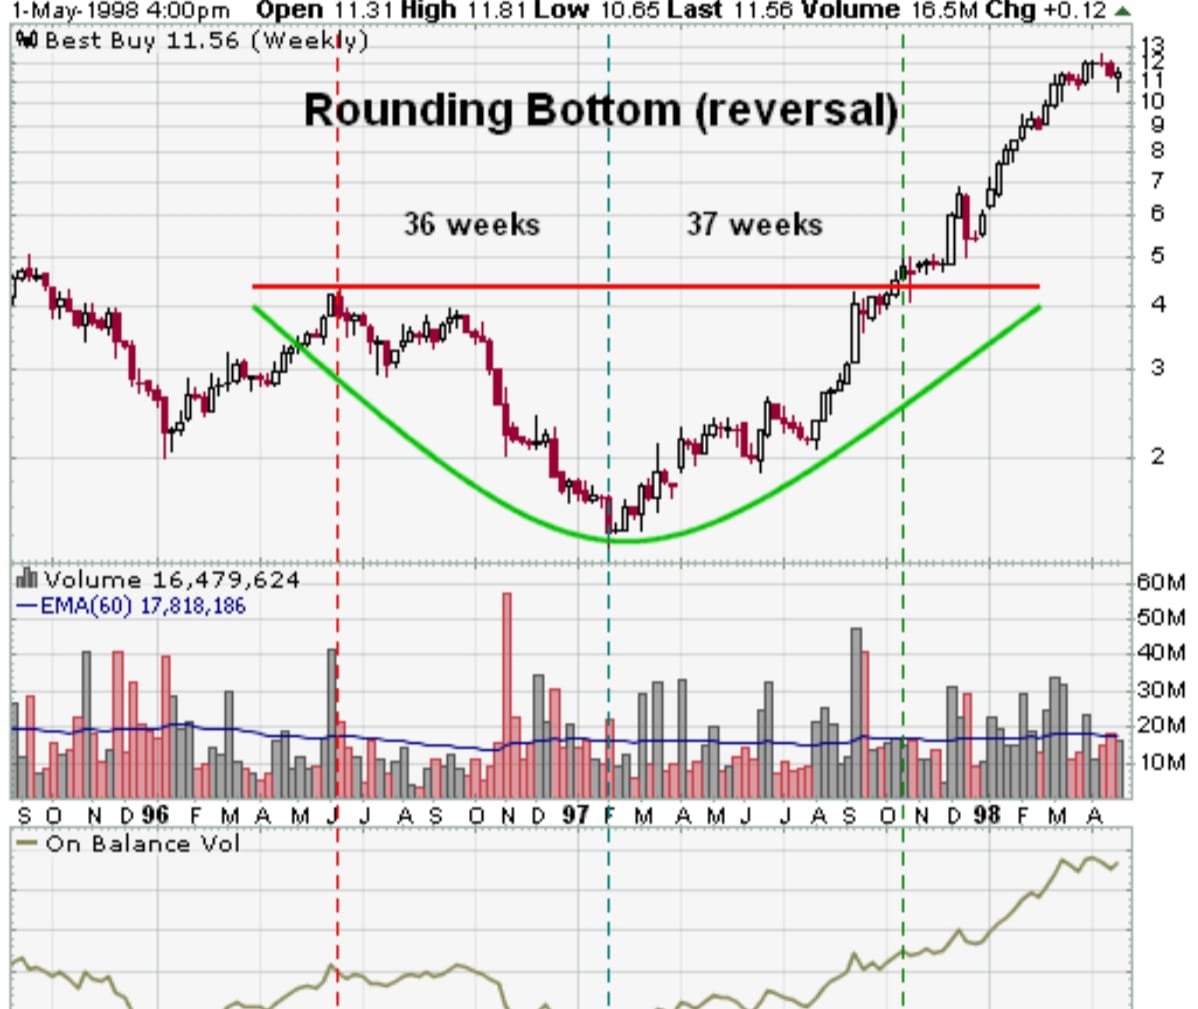
- This pattern is also known as a saucer bottom and represents a long-term reversal pattern. It suggests a shift from a downtrend to an uptrend.
- Three White Soldiers and Three Black Crows:
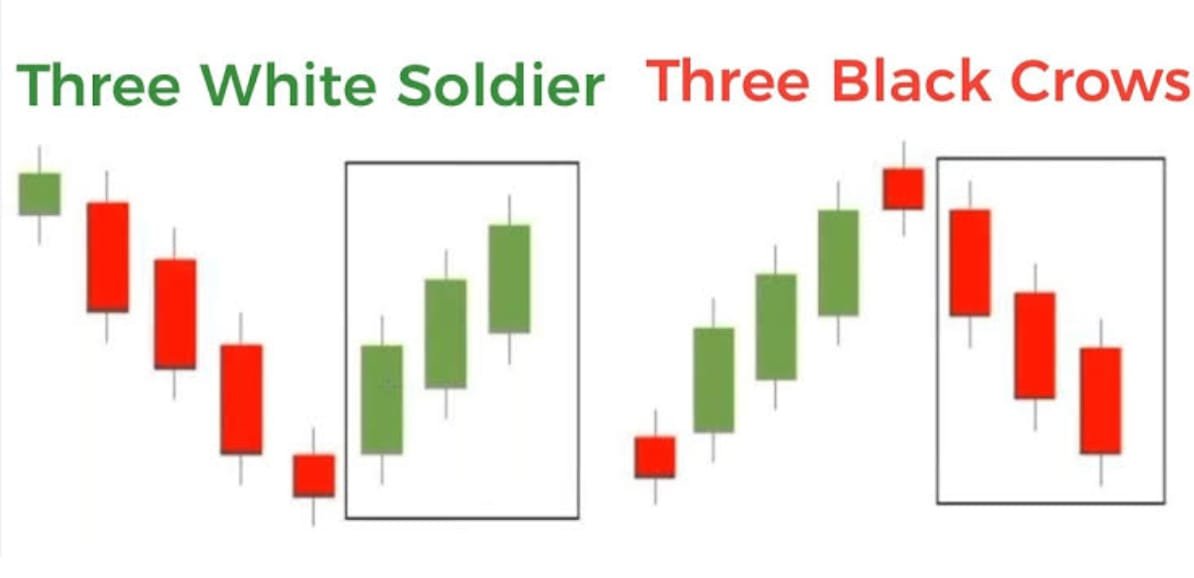
- These are candlestick patterns that consist of three consecutive bullish (white soldiers) or bearish (black crows) candles. They indicate strong buying or selling pressure.
Remember that successful trading involves a combination of technical analysis, fundamental analysis, risk management, and market awareness. It’s crucial to conduct thorough research and possibly seek advice from financial professionals before making investment decisions. Additionally, market conditions and dynamics can change, so staying informed is essential.
DOWNLOAD APPhttps://app.groww.in/v3cO/3dtoa50w
JOIN TELEGRAMhttps://t.me/+KO5ZarymwStiOTY1
Remember that chart patterns are just one tool in technical analysis, and they should be used in conjunction with other indicators and analysis methods for comprehensive decision-making in trading. Additionally, no pattern is foolproof, and risk management is crucial in trading.
https://techppboss.com


